Data Analytics Industrial Training in Mohali | Solitaire InfosystemsData Analytics Industrial training in Mohali - Solitaire Infosystems
Request a Quote !

Request a Quote !

Request a Quote !

Blogs

Data Analytics Industrial training in Mohali

  • By: admin
  • date: Sep 25, 2025
Blog Image

Most students who start data analytics training already know what a pivot table is. What they haven’t done yet is take a messy export (blank rows, duplicate entries, dates in three different formats) and turn it into something a manager can understand in five minutes. That gap is what industrial training is meant to close.

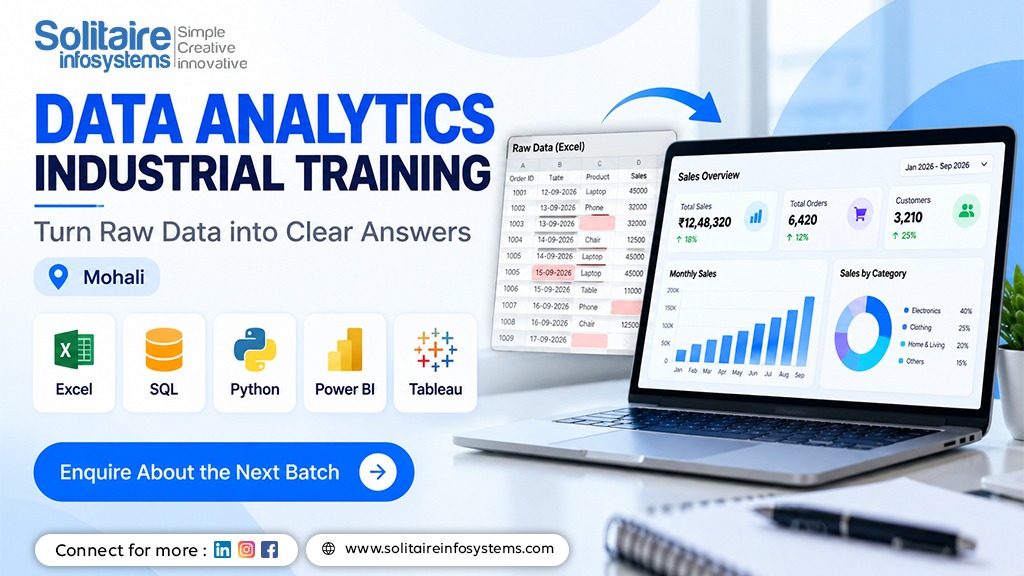
Our Data Analytics Industrial Training in Mohali is built around that kind of work. You’ll learn Excel, SQL, Python, Power BI and Tableau, but the tools are only half of it. The other half is the workflow behind them: asking the right question, cleaning the data, finding what actually matters and explaining it clearly.


What Is Data Analytics Industrial Training?

Industrial training is the practical part of many degree programmes. Depending on your university, it’s often six weeks or six months. In data analytics, that time goes into working with real datasets instead of reading about tools.

Data analytics itself is easy to define: looking at data to understand what happened, why it happened and what to do next. A retail store checking which products slow down in which months. A clinic tracking missed appointments. A college looking at which courses lose the most students after the first semester. The tools change from job to job. The thinking doesn’t.


What You’ll Learn


Excel for Cleaning and Reporting

A lot of real analysis still starts in Excel. You’ll use it to clean and organize data (removing duplicates, fixing formats, using lookup functions) and then summaries it with PivotTables and charts. It sounds basic, but a good share of entry-level analyst work is exactly this, done quickly and without errors.


SQL for Getting Data Out of Databases

Company data usually sits in databases, not spreadsheets. SQL is how you get it out. You’ll practice filtering, sorting, grouping and joining tables. A typical example is pulling monthly sales by region when the sales and region details are stored in two separate tables. If you only learn one tool really well, make it SQL. It’s the one you’ll use most once you’re working with real company data.


Python for Analysis

Python, with libraries like Pandas and NumPy, handles what Excel struggles with: larger files, repetitive cleaning steps, and analysis you want to rerun next month without redoing everything by hand. Matplotlib lets you chart the results. If you haven’t coded before, this is the section that needs the most practice, and it pays off.


Dashboards with Power BI and Tableau

Most businesses look at analysis through dashboards. You’ll build interactive reports in Power BI and Tableau that let someone filter by month, product or location and find the answer themselves, instead of asking you for a fresh report every week.


Statistics and Problem-Solving

You don’t need advanced maths. You do need to know when an average is misleading, what the spread of values is telling you, and why two numbers rising together doesn’t mean one caused the other. That’s the difference between reporting numbers and interpreting them.


How the Project Work Runs

Each tool is practiced on a dataset, not a slide. Project topics vary by batch, but the process follows the same steps an analyst uses at work:

Start with a clear question, such as “Which product categories lost sales last quarter?”

Check data quality: missing values, duplicates, inconsistent entries.

Clean and prepare the data in Excel, SQL or Python.

Analyze the patterns and test your assumptions.

Visualize the results in a chart or dashboard.

Write a short summary: what you found, how confident you are, and what you’d check next.

That last step gets skipped more often than it should. Being able to explain your findings in plain language is what makes a project worth talking about in an interview.

If your college asks for an internship rather than industrial training, or you want both, have a look at our IT Internship Program.


Who Is This Training For?

It’s a good fit for students who need industrial training as part of their degree, typically from BCA, MCA, B.Tech, Requirements can differ from batch to batch, so check with our team before you enrol.


Where These Skills Can Lead

Data analytics skills are used in entry-level roles such as data analyst, reporting analyst, MIS executive, business intelligence trainee and analytics intern. Which of these you can realistically aim for depends on how well you know the tools and, honestly, on the quality of your projects.

Two or three well-documented projects, each with a clear question, a clean method and a readable summary, tell an employer far more than a long list of software names on your CV.


Why Learn With Solitaire Infosystems?

Solitaire Infosystems is based in Mohali, and our training is practical and mentor-guided. You work through real analysis steps yourself instead of just watching demos, and you finish with work you can actually explain.

Before you join, talk to us about the current syllabus, batch timings and duration. We’d rather you pick the option that fits your college’s requirements than sign up for the wrong one.


Frequently Asked Questions


What is data analytics industrial training?

It’s hands-on training where you learn to clean, analyze and present data using tools like Excel, SQL, Python, Power BI and Tableau. Students usually take it to complete their degree’s industrial training requirement.


Which tools are covered?

Excel, SQL, Python (with Pandas, NumPy and Matplotlib), Power BI and Tableau, along with basic statistics and reporting. Ask our team for the detailed syllabus of the current batch.


How long is the training?

It depends on what your college needs. Six-week and six-month formats are common. Contact us to find out which options are available right now.


What’s the difference between industrial training and an internship?

Industrial training is a structured programme focused on building skills through guided practice. An internship puts more weight on working on tasks in a team setting. Some students do both. Our internship route is linked at the end of this page.


Will this training get me a data analyst job?

No training can guarantee a job, and you should be wary of anyone who promises one. What this training gives you is the skills and project work employers look for in entry-level analyst roles. The rest depends on your practice, your projects and how well you explain them.


Start Your Data Analytics Training

Need industrial training this semester, or just want to learn analytics properly? Get in touch with our team to check the syllabus, batch dates and duration, and we’ll help you choose the right option.

Prefer an internship format? Explore our Data Analytics Internship in Mohali and Chandigarh.

About the Author

Comments